Turn financial statements into a review of earnings, liquidity and repayment capacity. Spread the statements, compare reporting periods and bring aging reports and debt schedules into the coverage analysis.
Convert financial statements and supporting schedules into comparable spreads, charts and coverage analysis, with the source detail available for review.
Document
SpreadSpace
Trace to source
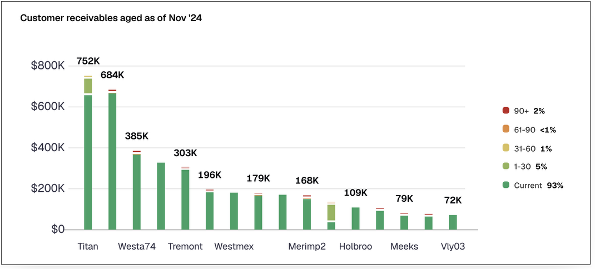
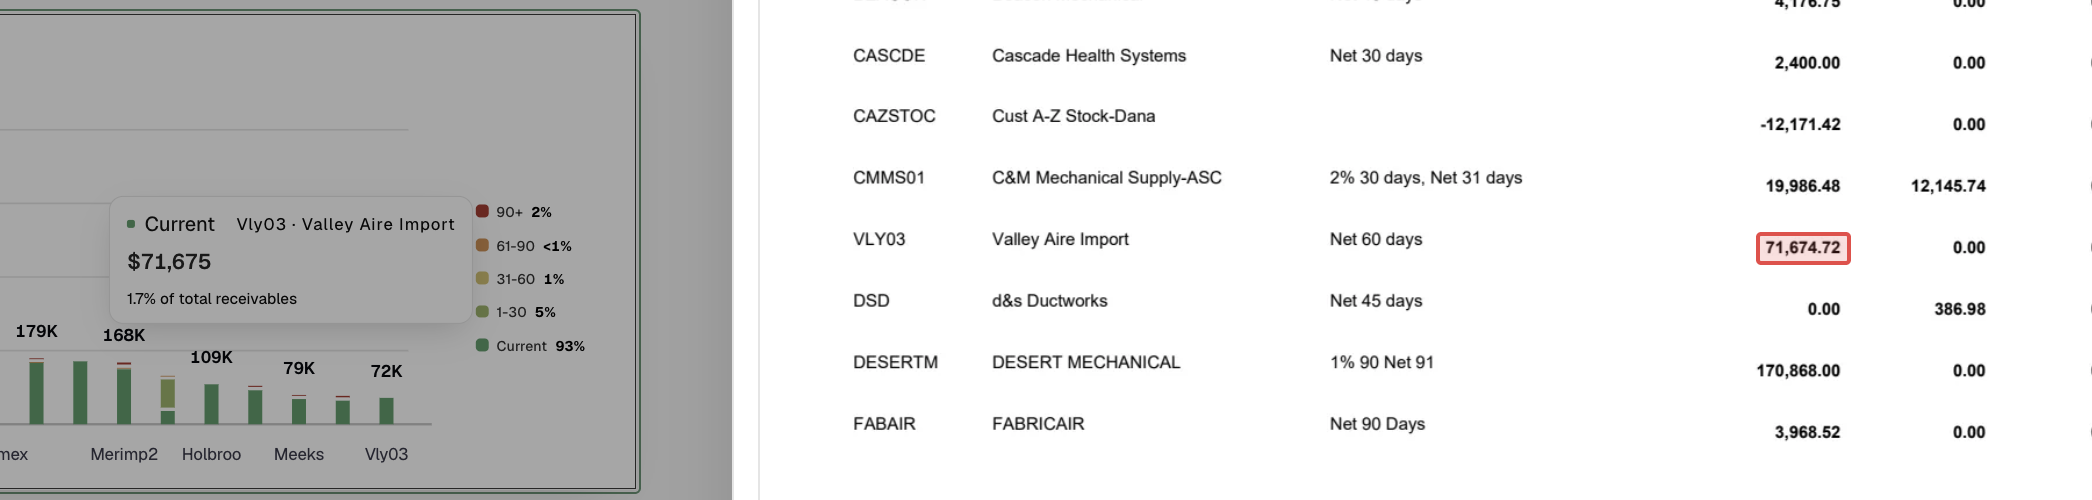
Illustrative examples from separate financial datasets. The source highlight shows the amount behind the selected chart value.
Statements into comparable spreads
Organize balance sheets, income statements and cash flow statements in a consistent view. Compare revenue, margins and working capital across reporting periods.
Line items into visual summaries
Turn rows of balances and activity into charts that make changes, concentrations and aging patterns easier to review.
Earnings and debt into coverage
Bring the selected earnings basis, analyst adjustments and debt service together for historical and proposed-debt coverage analysis.
Spread figures back to their source
Trace a chart value or spread figure to its supporting document, with a bounding box highlighting the source amount.
What you can underwrite
Spread the statements together
Review balance sheets, income statements and cash flow statements in a consistent layout. Keep the company, reporting period and source document attached to the figures, so the analyst can move between the spread and the statement being reviewed.
Compare performance over time
Compare revenue, expenses, earnings and balance sheet changes across the periods provided. Monthly detail, where available, helps the analyst investigate seasonal movements and distinguish a change in timing from an ongoing trend.
Review working capital and debt
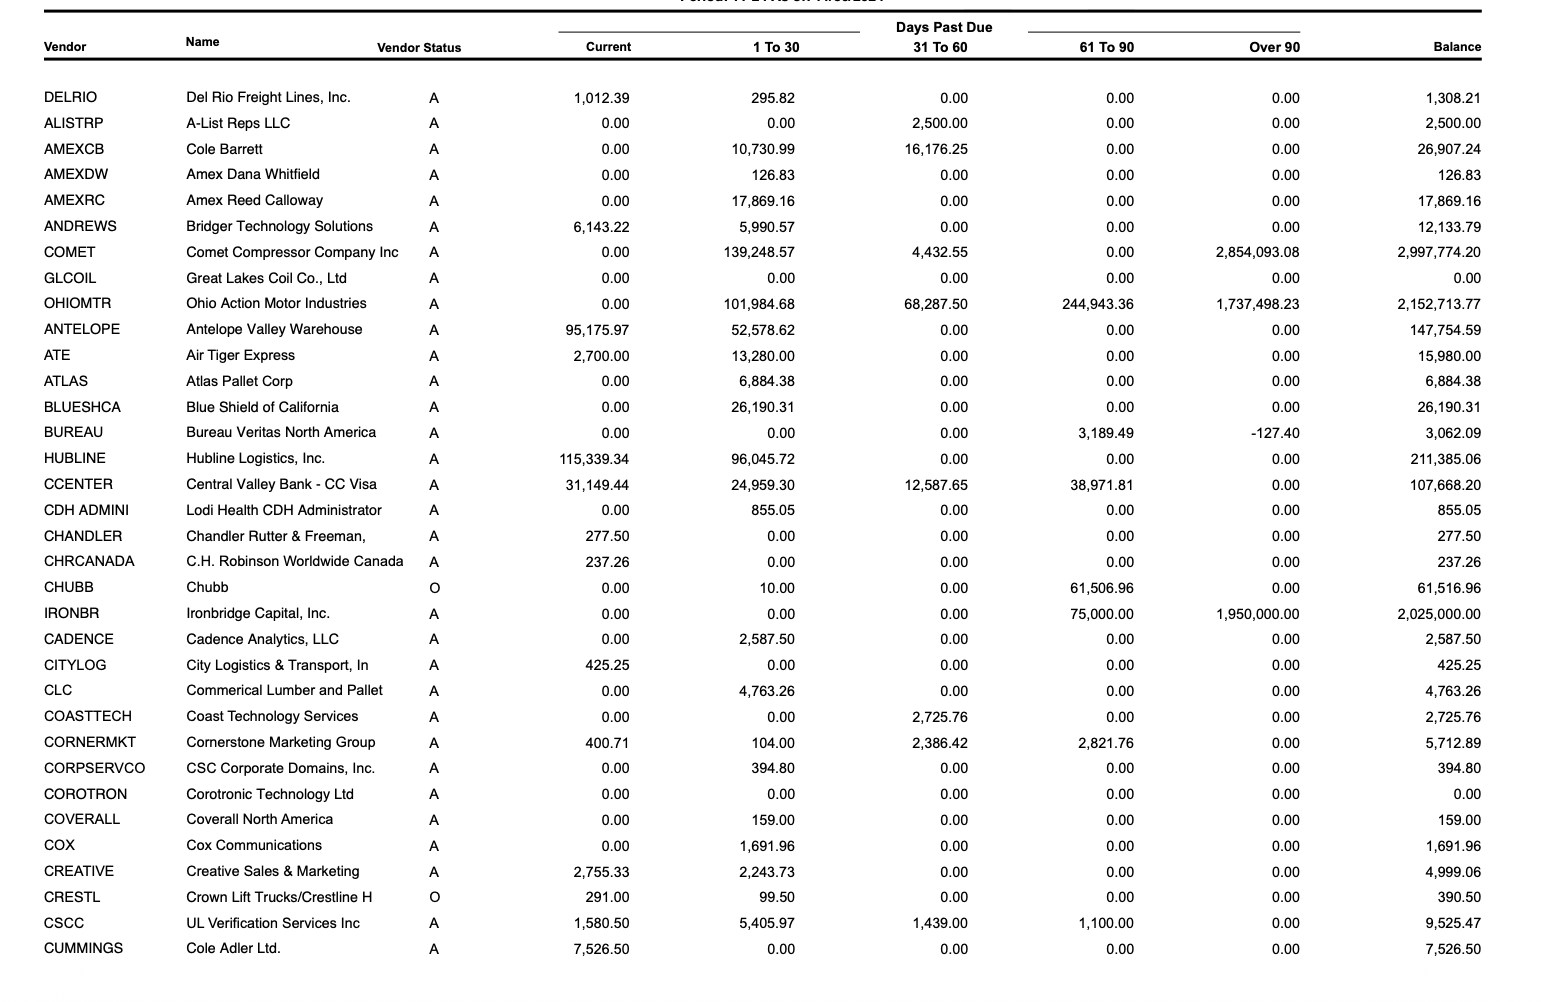
Bring accounts receivable and accounts payable aging reports alongside the statements. Review the debt schedule and its obligations with bank activity and the related returns to identify differences that need an analyst’s attention.
Build the coverage view
Use the selected earnings basis, analyst adjustments and debt service to review coverage. Compare the historical analysis with a pro forma view that includes proposed debt, and keep the assumptions available when the results move into the credit memo.
Read the detail behind current assets
This sample balance sheet separates cash, receivables, inventory and prepaid expenses. In the underwriting review, the analyst can inspect those components, compare periods and bring in the receivables aging report to understand what supports the reported working capital.
Sample balance sheet detail. The supporting components stay available when reviewing liquidity and working capital.
Carry the analysis, source detail and analyst assumptions into the credit memo.
Financial statement document details
Explore the statements, aging reports, debt schedules and personal financial statements available for review. Integration details are in the docs.spreadspace.app.
Balance Sheet
Statement Spine
Every line item
Current Assets
Cash and Cash Equivalents 226,076.30Total Current Assets 627,126.90